


Leveraging Data for Remote Diagnostics with DX Monitor®
Published on July 9, 2026
You may have heard a new catch phrase in our industry: ‘Data is the new oil’. Data has become more valuable than ever. Data determines how we make decisions. From in-store planograms to payment transaction speeds to fuel dispenser uptime, data drives our ecosystems.
Dover Fueling Solutions® (DFS) connected solutions platform is capable of delivering this decision-driving oil to your key stakeholders in real time through DX Monitor®. DX Monitor is a remote diagnostics platform that provides a range of data from a variety of sources on every transaction, allowing you to manage your forecourt from anywhere.
Let’s take a detailed look at one example: flowrate at the dispenser and its impact on customer experience. Not only is fuel flowrate a great way to gauge overall dispenser health; flowrate ties directly to retailers’ bottom lines.
What problems can be identified with flowrate data?
A single slow flowrate is no reason to worry, but the time to pay attention is when a pattern emerges. To save customers time, DX Monitor is equipped with proprietary smart algorithms to recognize these patterns at scale.
What does this mean? A dispenser gradually collecting dirt in the filter can’t hide among thousands of healthy dispensers from our trends analysis methods.
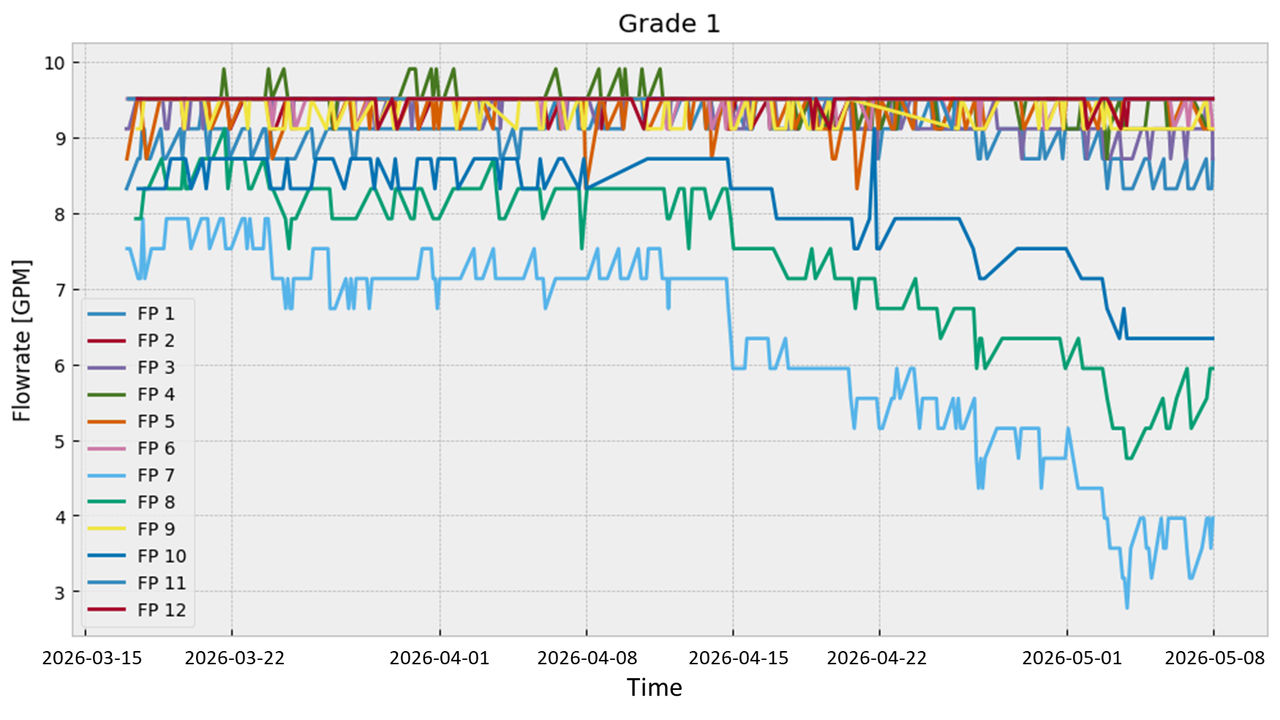
FPs 1, 8 and 10 show downward trends and slower flowrates, a symptom of filter clogging.
What else does DX Monitor detect? Rapidly spreading contaminants causing a sudden drop.
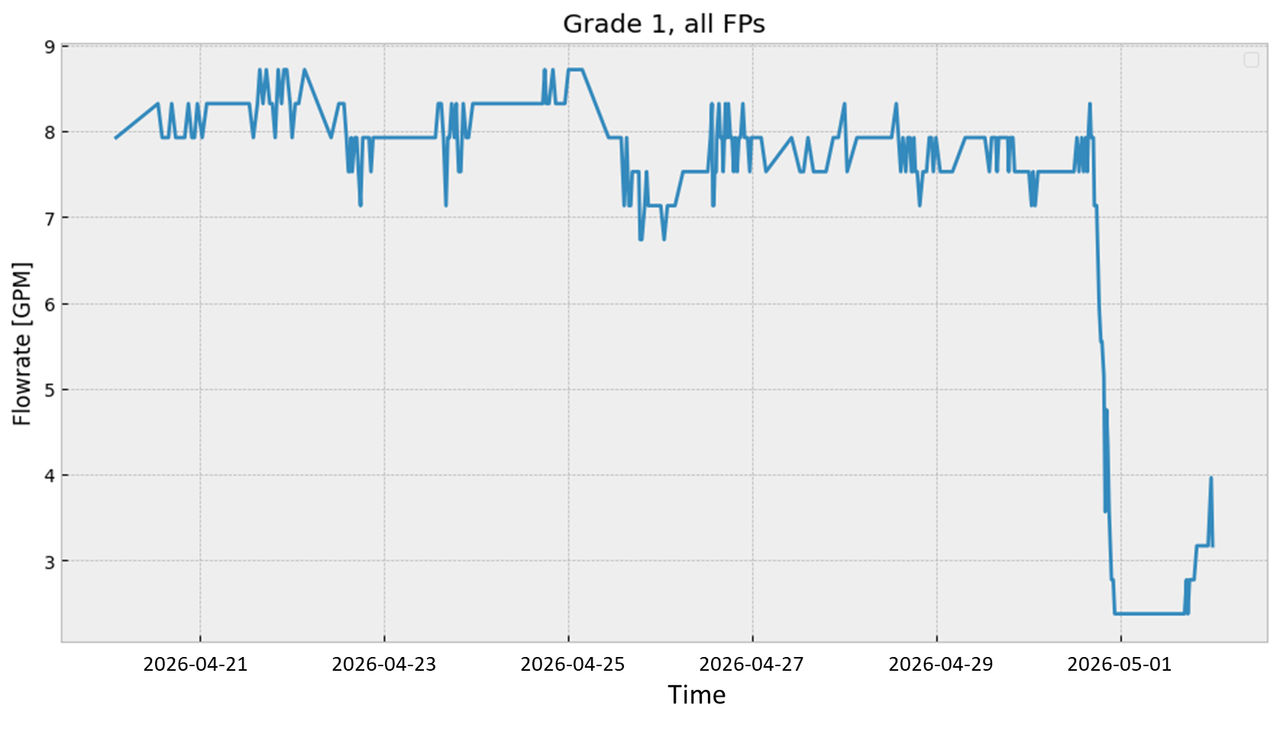
Sudden drop in flowrates at the end of the graph suggests something is wrong with grade 1 at the tank level.
Fuel dispensers under DX Monitor protection are being analyzed multiple times a day, resulting in automated alerts.
How does DX Monitor’s smart logic help gas station owners?
Imagine a day in the life of a diligent site owner or maintenance supervisor. One morning, they receive a notification about flowrate dropping at one of the sites they manage.
.svg)
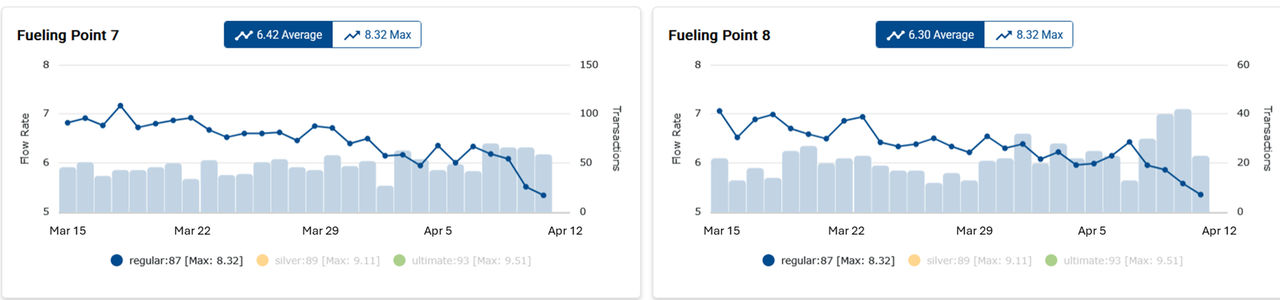
With a few clicks in DX Monitor, the site owner is able to see clear data trends confirming it’s time to replace the filters on fuel dispenser 7/8.
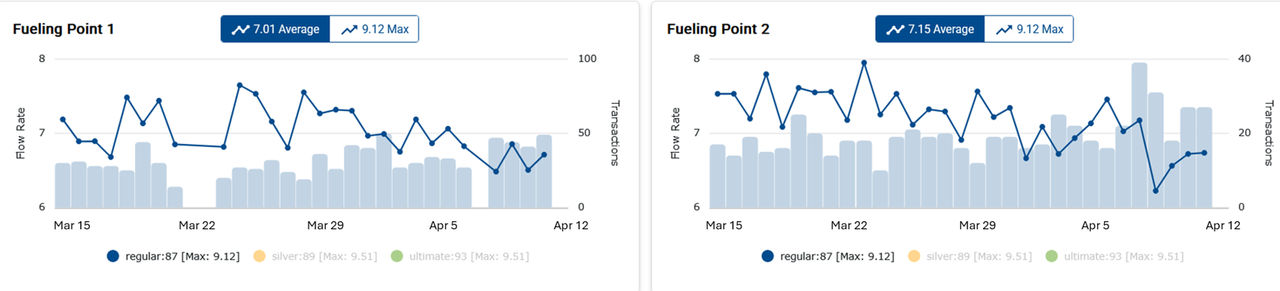
Reviewing the analytics for the entire forecourt, they also notice that, while dispenser 1/2 has not triggered an alert yet, it too is trending towards needing filters replaced. They're then able to add a preventative maintenance ticket onto an existing visit, saving time and an additional truck roll.
Reducing truck rolls is crucial for operations due to the costs and labor required with each one. This efficiency is even more important when gas stations are 60, 90, 120 miles from the nearest technician, and drive time adds up quickly.
This scenario is one example to illustrate a point, but the impact is real: automated data analysis at scale can save operators time and money. Site owners can move from scheduled maintenance on approximate schedules to targeted interventions where they are needed most. Improving site efficiency and lowering total cost of ownership is the name of the game, and DFS is delivering a cloud-based solution to empower customers to do both.
Finally, note that the presented example is still mostly reactive, triggering alarms when some flowrates already occur. We can go beyond that and predict degradation of flowrates and other diagnostic metrics in advance. Expect to see more predictive capabilities in further versions of DX Monitor and SiteIQ.
Related Products
Need Help?


.png)

Copyright © 2026 Dover Fueling Solutions® | A Dover Company | Privacy Policy | Cookies | Terms of Use


Dover Fueling Solutions
Dover Fueling Solutions